El Niño Synthetic (Stochastic) Flood Event Catalogue: Peru
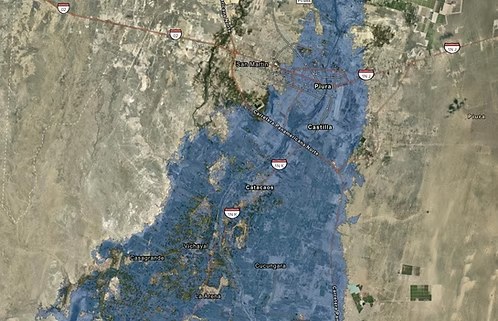
Up to 15,000 stochastic riverine flood events simulated under El Niño and Super El Niño rainfall conditions, covering Peru.
- 15,000
- simulated El Niño years
- 12 m
- spatial resolution
- 8
- return periods, RP5–RP1000
The dataset
What you receive.
The format is compatible with most GIS and catastrophe modelling software.
- EVENTS
- Up to 15,000 stochastic riverine flood events
- CLIMATE CONDITIONS
- El Niño and Super El Niño rainfall, simulated for El Niño convective periods
- COVERAGE
- Peru
- FORMATS
- Raster files — .tif / GeoTIFF / .vrt
- RETURN PERIODS
- RP5
- RP10
- RP25
- RP50
- RP100
- RP200
- RP500
- RP1000
- SPATIAL RESOLUTION
- 12 m, one flood hazard layer per return period
- METHOD
- Hydrological modelling
- SERVICES
- Dataset licence, or portfolio loss analysis run on your exposure
Workflow
From 15,000 El Niño years to flood hazard maps.
Synthetic El Niño events
Simulation of 15,000 El Niño years.
Synthetic convective storm catalogue
Storms generated under El Niño, Super El Niño, La Niña and neutral conditions.
Riverine flood modelling
Flood events derived from the simulated convective storms.
Portfolio analysis service
Run your portfolio through 15,000 El Niño years.
Don't have the in-house setup to use the hazard layers? Send us your exposure and we run it against the stochastic catalogue in catastrophe modelling software, returning the loss metrics your underwriting and capital teams need.
Send your exposure
Locations with insured values and, where available, construction and occupancy.
We run the catalogue
Your portfolio is analysed against the El Niño synthetic flood events in catastrophe modelling software.
Receive your loss results
Average annual loss (AAL), exceedance-probability curves (OEP / AEP) and losses by return period, with a method note.
Purchase
Priced on request.
To purchase this dataset, please contact our scientific team via the “Contact” form.
Go-Stochastics is a service provided by GEOUMA Sciences.